Geometry-aware risk estimation for vehicle interactions.
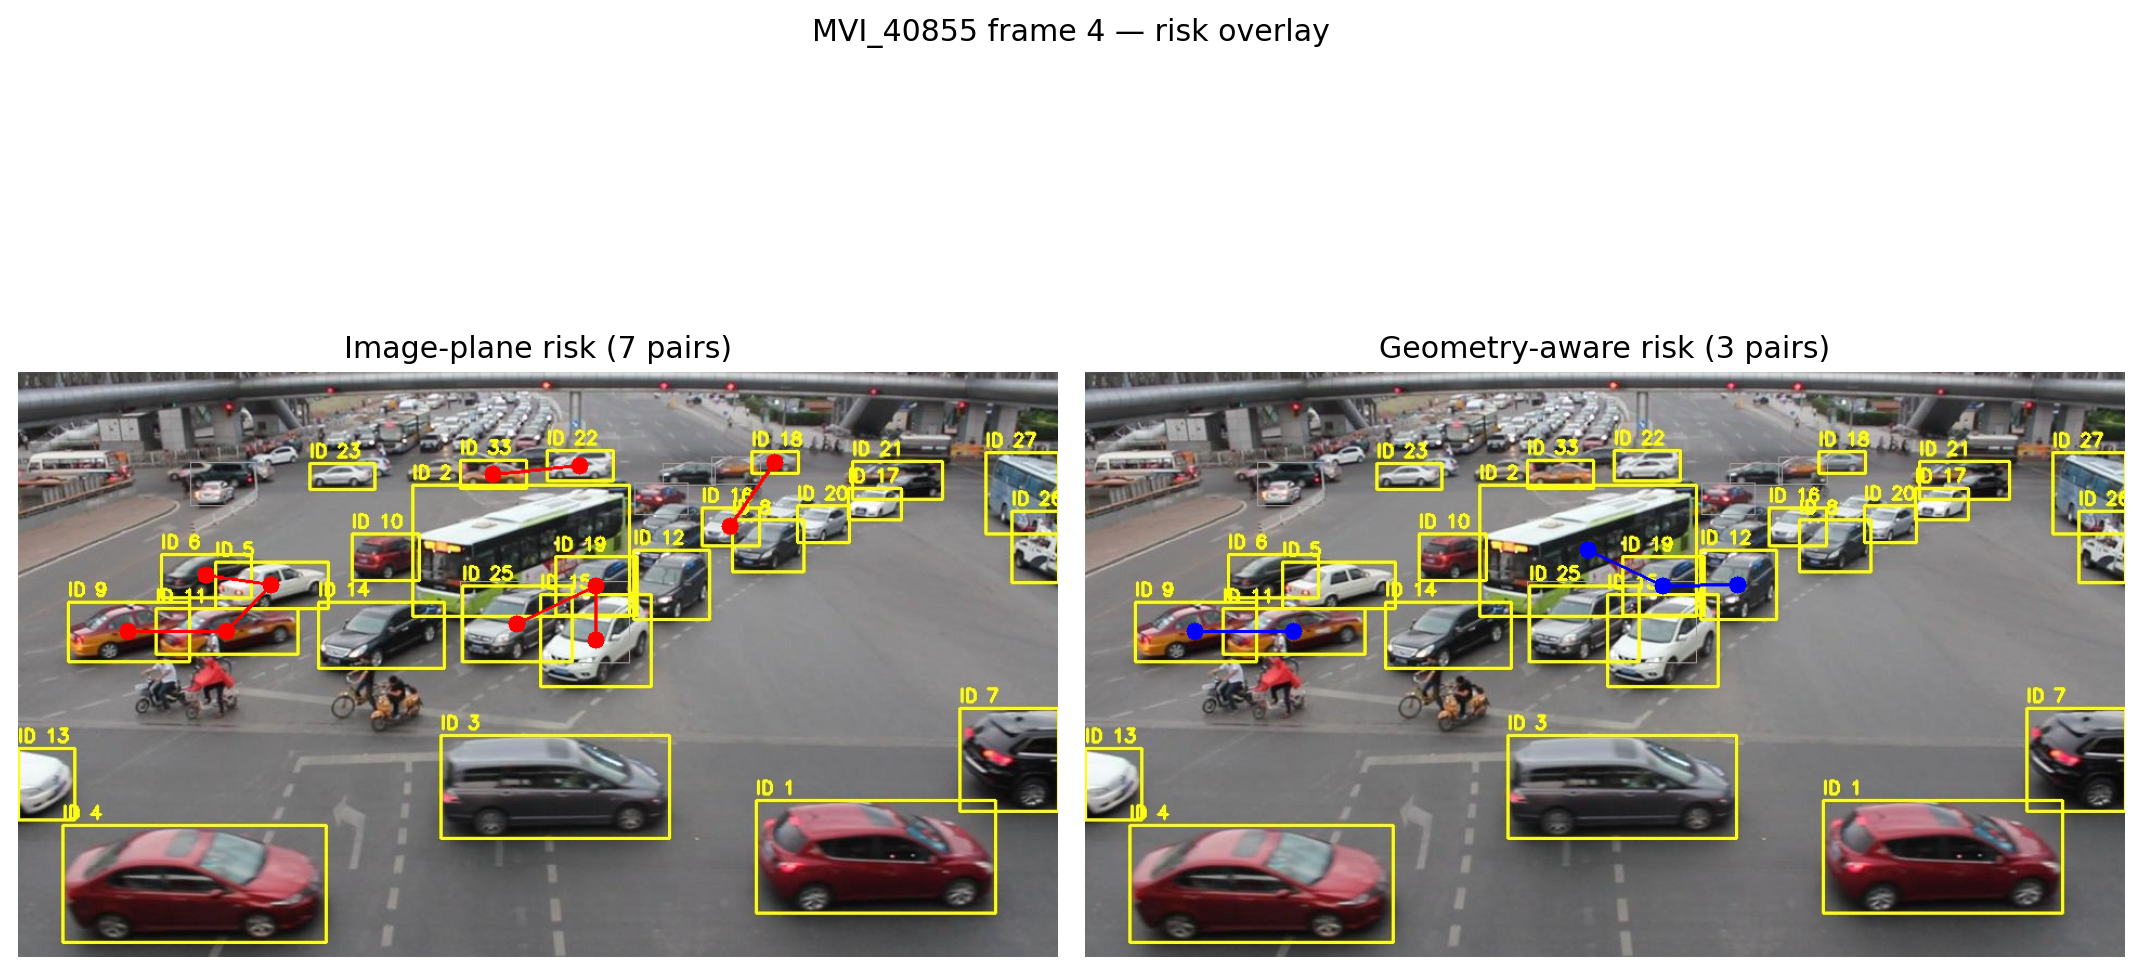
Pixel distance is not physical distance.
Traffic cameras flatten a three-dimensional scene. Near the horizon, vehicles that are far apart in the world can sit only a few pixels apart; near the camera, equivalent motion spans far more pixels. A risk model operating directly in image space inherits that distortion.
The project isolates this failure mode by comparing two risk scorers with the same pairwise features—distance, closing speed, and time-to-collision—but different coordinate systems.
Detect
YOLOv8n identifies cars, buses, and trucks.
Track
ByteTrack maintains identities and trajectories.
Project
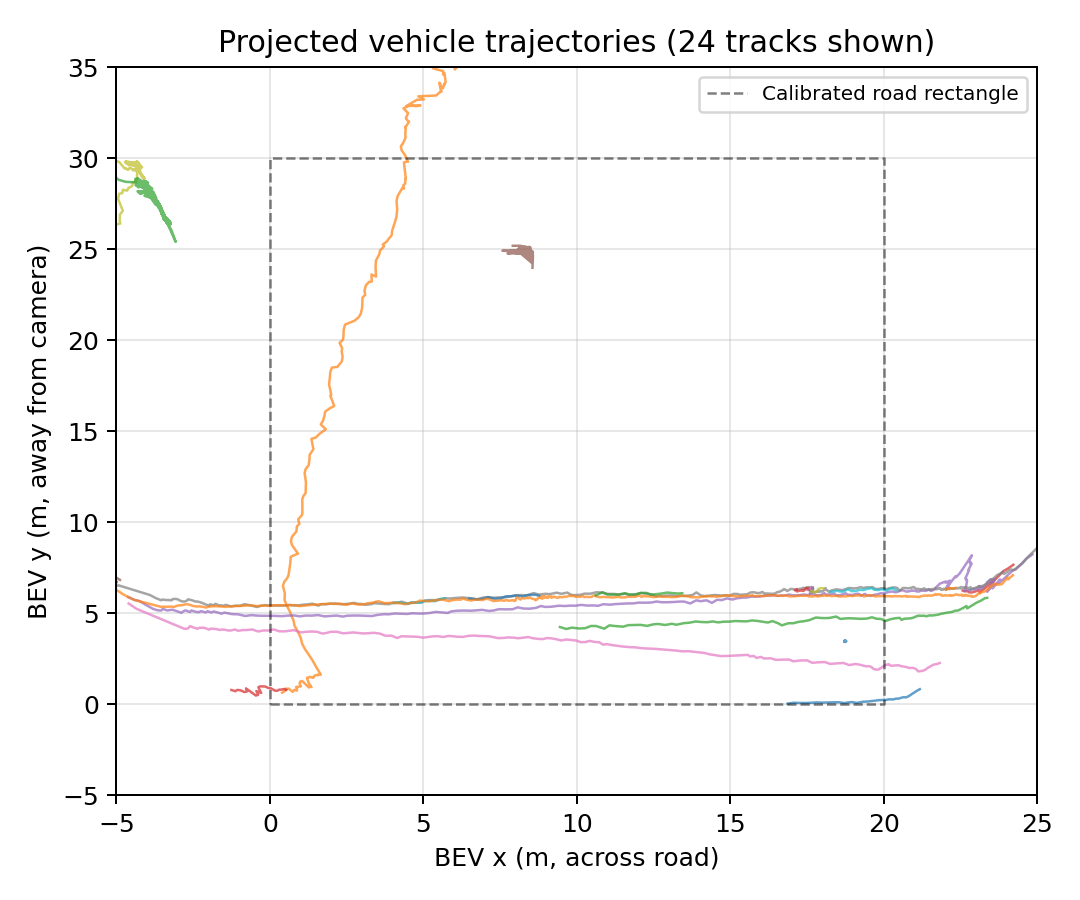
A normalized DLT homography maps motion to BEV.
Score
Distance, closing speed, and TTC flag risk.

Geometry removed an order of magnitude of noise.
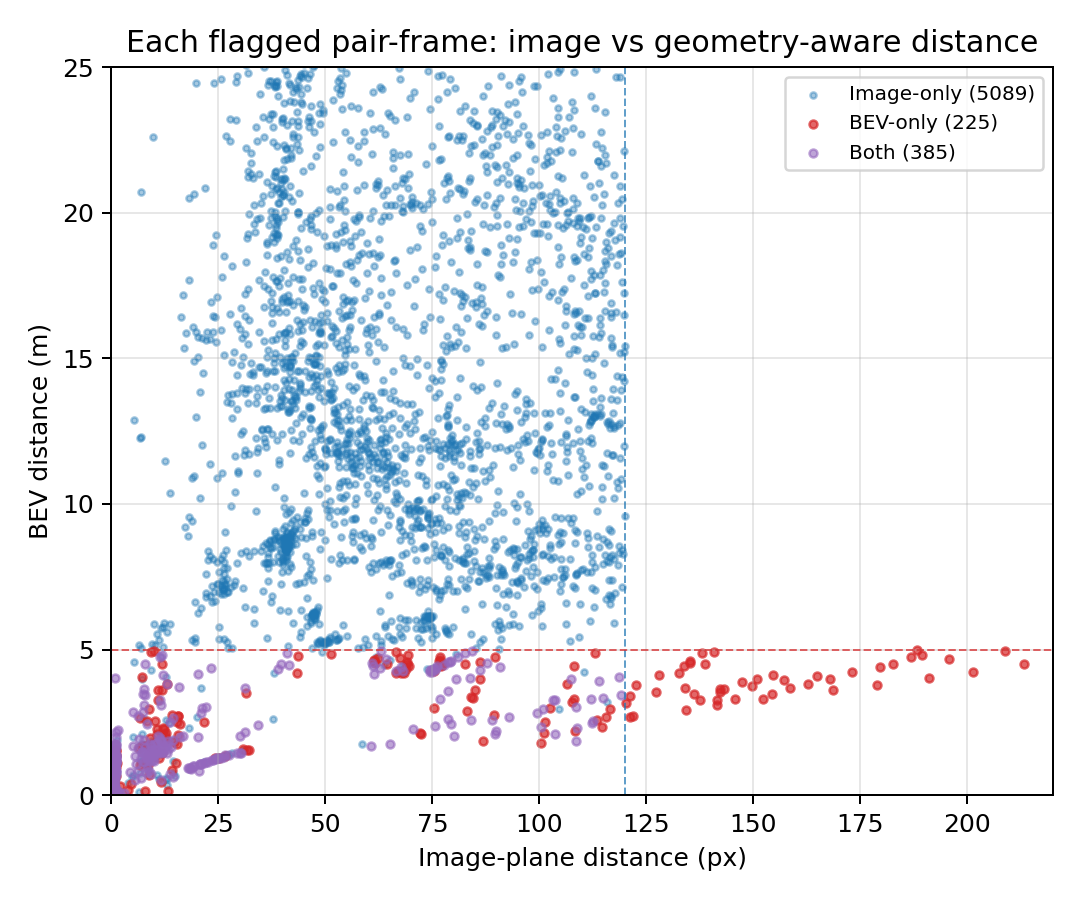
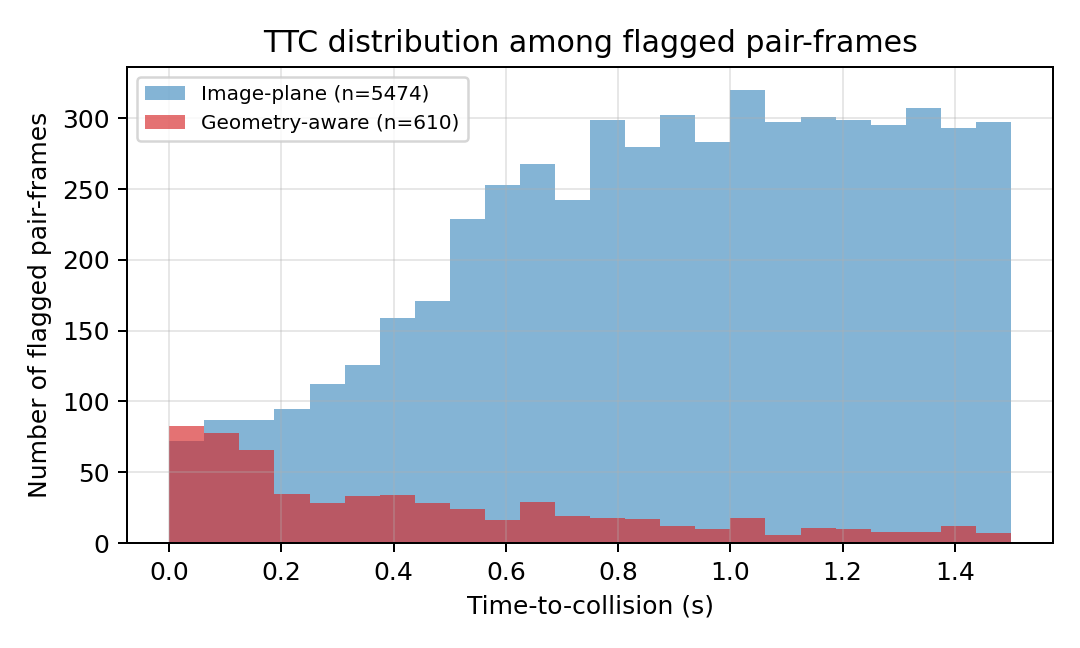
The image-plane baseline flagged 5,474 risky pair-frames across 830 unique pairs. The geometry-aware variant flagged 610 pair-frames across 108 unique pairs. The two methods agreed on only 11.4% of the unique pairs they flagged.
That disagreement is the result: many apparent risks were artifacts of perspective compression, while the BEV method concentrated on physically close, rapidly closing vehicles.

What held up
A minimum-track-age ablation reduced both event sets without changing the qualitative disagreement. A distance-threshold sweep showed that the result was not a quirk of one chosen cutoff.
What I’d improve
The model treats vehicles as point masses, assumes a flat ground plane, and uses a minimal four-point calibration. A production extension should use an overdetermined calibration, heading-aware geometry, uncertainty estimates, and benchmarked ground truth.

Amaan Khan · Anirudha Kyathsandra · Dennis Binford · Mingyao Wang
CS 543: Computer Vision · University of Illinois Urbana-Champaign